


The MVTA video analysis software helps automate time and motion analyses of visually discerned activities through an innovative interactive graphical user interface. MVTA uses custom multi-media software and digital video files (AVI or MPEG) or a computer-controlled VCR to facilitate interactive study of video recorded activities. Video activities can also be analyzed using digital video files obtained from a video capture board or digital video recorder. Arbitrary events are discerned by interactively identifying terminal break points in the timed activity. Break points are characteristic occurrences that define the start and end of an event. The video record may be reviewed at any speed and in any sequence (real-time, slow motion, fast motion, or frame-by-frame in either forward or reverse direction). Analysts can replay any event as much as desired in a continuous loop or direct the video to display an arbitrary event or point in time in stop-action. MVTA produces conventional time study reports, and it computes the frequency of occurrence for each event.
Multimedia video tape players can directly communicate with, and be controlled by a computer. The computer is therefore able to address and locate individual images on the video tape and know the current location and time on the video tape. This enables the computer to keep track of events and frees the user to concentrate on activity and event identification, reducing the work required. Manual control of the video player is also eliminated. The user need only select the event of interest and instruct the video player to locate the correct segment on the tape or on the digital video file
MVTA is a versatile instrument with numerous applications in many fields. Some of the analyses that the system can be used for include:
| Activity sampling | |
| Checklists | |
| Behavior observation | |
| Detailed job analysis | |
| Elemental Analysis | |
| Event Analysis | |
| Left-hand/Right-hand Analysis | |
| Micro-motion Analysis | |
| Posture Analysis | |
| RULA or OWAS | |
| Task Analysis | |
| Time and Motion Study | |
| Work sampling |
Typical fields of application include:
| Industrial Engineering | |
| Biomechanics and Kinesiology | |
| Work physiology | |
| Ergonomics | |
| Psychology | |
| Zoology | |
| Human Factors Engineering | |
| Training | |
| Sleep Labs | |
| Sports and Athletics | |
| Rehabilitation | |
| Human-Computer Interaction |
|
· Minimum of Pentium compatible PC with Microsoft Windows™ 98/2000/ME/NT 4.0/XP with Media Player 7.0 or higher (DirectX 8.0 or higher). A Pentium™ II or higher based PC is recommended | |
|
· 3.5” floppy drive (optional). | |
|
· CD-ROM drive | |
|
· SVGA (1024 x 786) color monitor (minimum) | |
|
· SVGA (1024 x 786 in 16 colors) graphics adapter (minimum) | |
|
· 64MB RAM memory (128MB recommended), 128MB for NT/2000/XP | |
|
· 10MB hard drive space for programs and sample data files. Additional space requirements dependent on the size and number of data files (approx. 5KB per analysis file (350 events)) | |
|
· Slot available for Video Card (optional) | |
|
· 1 serial port for VCR control (optional) | |
|
·
Video/Television Tuner Board or video capture card for Computer
(such as the Hauppauge WinTV™ PVR, Dazzle®Digital Video Creator, or any
Windows compatible overlay/TV tuner card), |
The following equipment is required if video tape playback is used:
Video Equipment
|
Panasonic AG-7350 or AG-7355 with AG-IA232TC RS232 Serial Adapter (required
for either model), | |
|
Future Video Media Commander 100 VCR Interface and any VCR supported by the Media Commander (The Media Commander supports well over 40 different brands and models of VCR s and camcorders.) |
Equipment Configuration Notes
Panasonic AG-7350/7355 with the AD-IA232TC module is directly supported and provides for maximum control and responsiveness between the PC and VCR.
The Future Media Commander 100 Interface provides a standard interface for using many different types of VCRs.
The Video Monitor is not required if the user selects the PC Tuner Board. The Tuner Board is a lower cost option and may not provide the image quality as using either the Panasonic or Media Commander 100 approaches. The image quality should be sufficient for most analysis situations. The video will be stored on the PC’s hard disk or on a CD-R disk, which must have sufficient storage capacity versus having the video stored on the VCR tape. MVTA uses a virtual VCR mode when the user has installed a Video Tuner/Capture Board to enable Digital Video files (AVI or MPEG) to be displayed and reviewed.
|
The main program window appears when the program starts (Figure 3). A new analysis file is automatically created when the program starts up, or when selecting NEW in the File menu. A previously saved analysis file may be opened using the File menu of this window. Any functions specific to an analysis window cannot be accessed until the analysis file is opened. Detailed descriptions of each menu function is presented in the Menu Reference section. A status/progress bar is located at the bottom of the main window. The status and progress of any process requiring time to complete is displayed here.
|
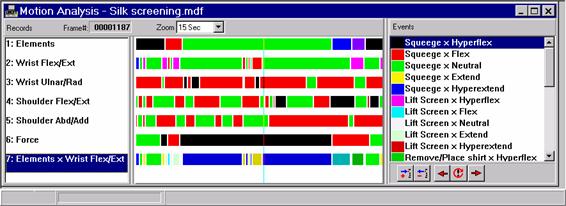
The main analysis window appears when a New or an existing file is selected using Open from the File Menu. The different areas of the analysis window are described below (Figure 4):
Record List Window The different records associated with the file are displayed in this window.
Frame Number The current video frame number is display here.
Timeline Zoom The time range is displayed and changed here.
Event List Window The events associated with the currently selected record is displayed in this window. Different colors represent the different event elements.
Timeline Window The timeline for each record is displayed in this window.
Time Cursor The cursor shows the current frame relative to the timeline. The current time as represent by the frame number relative to the timeline and the events.
Event Speed buttons Quick access buttons are used for assigning breakpoints, editing and deleting events.
Vertical scrollbars will appear in the Record List and Event List windows when the number of elements do not fit in the List window. The vertical bars between the Record List windows and the Timeline windows, and the Event List window and the Timeline windows can be dragged to resize the horizontal dimensions of the window.
The MVTA program provides many features that allow quick and easy event break point assignment and editing. The actual procedures are explained in detail in the Tutorial section. An overview will be presented to provide a better understanding of the break point editing process used by MVTA. The current video frame can be changed using the VCR control of the MVTA program or by the physical controls on the VCR. The computer will keep track of the current frame regardless of which method is used.
Event labels are created in the event list window. Each event list element can have a unique alphanumeric key associated with it. The corresponding key is pressed to mark the beginning of the event at the desired video frame. The timeline window is updated with the new break point. The break point can be edited at any time.
Two commonly occurring assignment errors are:
| Inserting a break point at the wrong video frame, or | |
| Marking the desired video frame using the wrong event break point. |
Break points marked at the incorrect video frame are corrected by moving the timeline cursor to any video frame in the event, deleting the event, then moving the timeline cursor to the correct video frame location and inserting a new event breakpoint. A break point marked using an incorrect event label can be corrected by moving the timeline cursor into any video frame in the event, selecting the correct event from the event list window, and changing the event using the command ( SHIFT -Click Delete Current Breakpoint ) or by pressing the SHIFT -Event Key. The currently selected event label replaces the incorrect event label for the event breakpoint.
There are situations when the analyst may be unable to determine which event is occurring until continuing to review activities later in the video record. Marking break points in this situation would require constantly shuttling the video to a video frame where the event can be determined, and then shuttling back to the beginning of the event. The "undefined" event feature can help solve this problem. At the video frame when the event begins, the analyst inserts an "undefined" event to mark the time by pressing the Escape key. After the video frame is advanced and the event is identified, the analyst marks the appropriate event by selecting the correct event label. The undefined event is then replaced by the actual event. This feature saves a great deal of time.
A "null" event is a special predefined event that is excluded from the analysis. Often this is because a portion of the tape is not recorded. All new analyses begin with all record list elements initialized as null events. Null events are ignored by MVTAT when generating reports. Null events should be used for segments of video that have discontinuities in time (such as when the tape was paused) or to break up unrelated analyses in the record timeline. Duration and frequency intervals are never calculated across null events.
A very powerful feature of the MVTAT program is record interactions. Interactions reveal the relationship between two activities at the record level. MVTAT allows two independently observed events to be combined to produce a new event that represents the coincidence of the two. For example, one may be interested in determining the intersection between events in Record 1 and Record 2 in order to determine the duration and frequency of the simultaneous occurrence of each combination of events. If Record 1 contains five events and Record 2 contains three events, the analyst would have to keep track of fifteen (3 ´ 5) different combinations. In Figure 5 the interaction between the Element record and the Wrist Flex/Ext record was created and displayed at the bottom of the records list. Note the interactions in the event list.
|
The record interaction feature of the MVTA program allows this type of analysis to be performed easily and quickly. The two records that interact are selected in the record list window while depressing the Ctrl key and dragged below the last position on the list and released. A new record is automatically produced with the interaction in the timeline windows and the new event combinations in the event list window. Additional information on the duration and frequency interval can also be obtained by generating a report of the new record produced by the interaction feature.
Four types of reports are available from the MVTA program:
1) Time study
2) Frequency
3) Breakpoint
4) Durations
Time Study: The time study report provides statistical information (mean, standard deviation, confidence interval, and sample size) on the duration of events. A detailed report can be generated based on the event list sequence for each record.
Frequency: This report provides statistical information (mean, standard deviation, confidence interval, and sample size) on the frequency of occurrence of similar events. A detailed report can be generated based on the event list sequence for each record.
Breakpoint : The Breakpoint report provides the actual time of successive events in the order that they were entered without any statistical analysis or additional processing. This report can be used as a means for exporting the event data.
Durations : The Durations report provides the duration or interval between adjacent events in the order that they were entered without any statistically or additional processing. This report can be used as a means for exporting the event duration data.
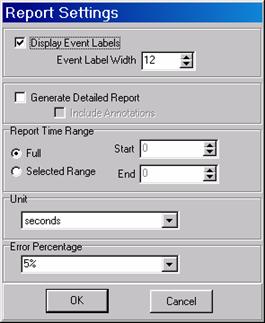
The report output characteristics can be customized from the report settings dialog box prior to each analysis (Figure 6)
|
Display Event Labels : If checked, the event labels will be used to identify the events instead of the event numbers associated with the event.
Event Label Width : This specifies the number of characters for the event labels.
Generate Detailed Report : If checked, the individual time intervals are displayed along with the summary statistics. If not checked, only summary statistics are displayed.
Include Annotation : If Generate Detailed Report is checked, Include Annotations is enabled. If Include Annotations is checked, any annotation associated with the individual event is also displayed in the report.
Report Time Range : Defines the time range of the current record that will be included in the report. Full uses all available data. Selected Range uses only the data that is completely included in the Start and End values.
Unit : The time study can be displayed in different time units. Select the units from the drop down list.
Error Percentage : The error is the ratio of the 95% confidence interval to the average event time as a percentage. The following error percentage levels are available, 1, 5, 10, and 20.
The options available are determined by the report type selected.
Figure 7 Report Window with Only Summary |
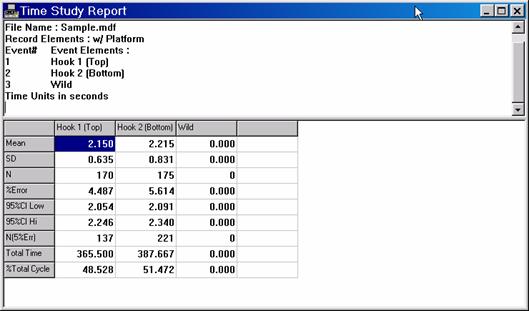
The upper section of the report window displays the type of report, the name of the analysis file, the record being displayed, the event numbers and event labels, and the units of the data. The lower section displays the analysis data. Each column corresponds to each event label. Individual cycle data are displayed when the Generate detail report option is checked in the report setting dialog. Summary statistics are always displayed at the bottom of the columns.
The mean, standard deviation, and number of data points are displayed along with confidence intervals, percent error, sample size needed for a given percent error, total cumulative event time, and percent of total cycle values. The upper and lower 95% confidence interval values are provided.
The percent error (%error) is the ratio of the 95% confidence interval to the average event time as a percentage.
The sample size required (N(5% Err)) value provides an estimate of how many data samples are needed for a percent error of 5%.. Percent error levels of 1, 5, 10, 20 are selectable.
The time study report provides information on the duration of all events arranged by events. The frequency report provides information on the interval of occurrence or repetition rate of all event elements. Summary statistics are provided in the time study and frequency reports. The raw time data report provides information on the times at which every event occurs. The duration report provides duration times from one event to the next in the order they occur.
An example of a time study report is displayed in Figure 7. The horizontal splitter bar between the two-display sections of the report window can be dragged to resize the display proportions.
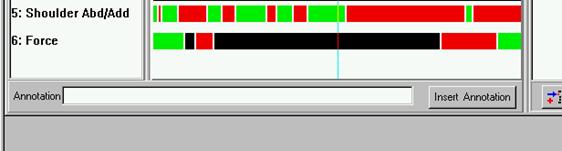
Supplemental information associated with an event can be entered and displayed in the annotation window. This information may be any alphanumeric string desired. Only a single annotation can be associated with an individual event up to 255 characters.
The annotation window is displayed/hidden by Events > Annotation . With the Timeline cursor located at an element of the desired record, pause or stop the video. Click in the edit box for the text bar to appear, and type the desired annotation. Click the Insert Annotation button to enter the annotation. The text will become red, indicating that it was entered. Replacing text entered and clicking on insert will change the previous annotation.
|
If previous annotations were assigned and the annotation window is displayed, the annotation message will appear in the edit box as the timeline cursor moves as the video advances. Previous annotations can be changed as described above.
When a set of records and events labels are used repeatedly in future analyses, they can be saved as a template file so the labels setup can be recalled without having to retype the record and event labels. This feature allows many different analyses to be stored in templates for quick retrieval (see section 6.2.10 and 6.2.11). If you wish a specific analysis to be recalled automatically when a new analysis is selected, save the template as the default template (see sections 6.2.8 and 6.2.9)
|
The majority of the menu commands and functions can be accessed from the main analysis window. The locations of the various analysis window components are identified below.
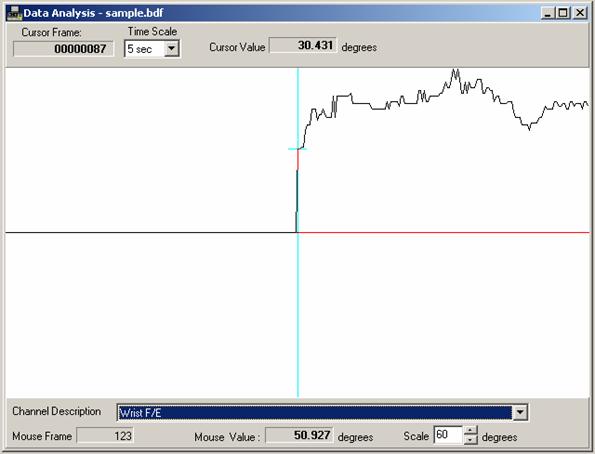
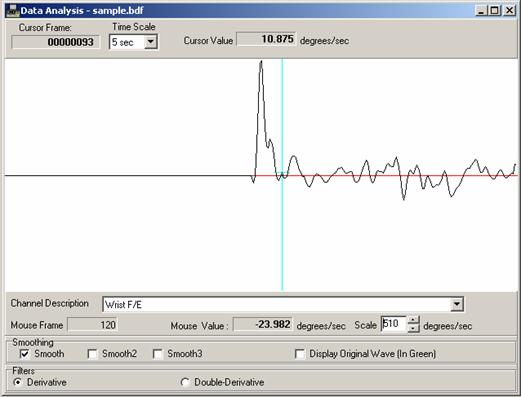
The display of the waveform can be adjusted by many controls. If the data analysis file contains more than one channel of data, the desired channel can be displayed by selecting the appropriate choice from the Channel Description drop-down combo-box. The amplitude and time scale can be changed by selecting or entering the desired value into the Amplitude Scale or Time Scale controls.
Time/Frame information can be obtained by the location of the cursors on the data analysis display window. The time/frame for the currently displayed video frame is shown in the Cursor Frame display box and by the blue vertical line Frame Cursor location. The Data Value at the Frame Cursor location is displayed in the Cursor Value display box. The Frame Cursor moves with the Video or by clicking in the Data Analysis at the desired location. The Time/Frame location of the mouse cursor is displayed by the Mouse Frame display box. The Data Value at the mouse cursor location is displayed by the Mouse Value display box. The Frame and Mouse Cursors are independent of each other. The Frame Cursor location is affected by and affects the video. The Mouse cursor location has no immediate affect on the video location.
The data scaling equations are used to convert the digital values of the stored data analysis file into engineering units. The channel information can be entered to describe the data and the data units. To change the scaling equations and channel information after the data has been collected and saved into a file, use the menu option Data Scaling. in the Data Menu. Change the desired information. Repeat for all channels to be changed. Scroll if necessary to reveal all channels. Press OK when completed. (See Figure 10)
During the Video and Data collection process, the Video and Data recording may not be started at the exact same time. This synchronization error can be corrected using the Video/Data Resyning option in the Data menu. Enter the frame number for the video in the Video Sync Frame edit box and the frame number for the data in Data Sync Frame edit box. (See Figure 11)

The data stored in the data analysis file (BDF) must be exported for further analysis.
This option creates a file in the text format for the channel currently displayed. The entire channel or selected range is processed. This format is useful for analyses performed by other programs not within the MVTA application. The file contains the timecode and data value in two columns. This file type is 'BTF" for biomechanical data file.
This option creates a text file for spectral analysis. The data is segmented by the break points of the currently selected motion analysis file. The file contains the timecode and data value in two columns with each segments separate by a blank line. This file type is 'BSF" for biomechanical segmented data file.
|
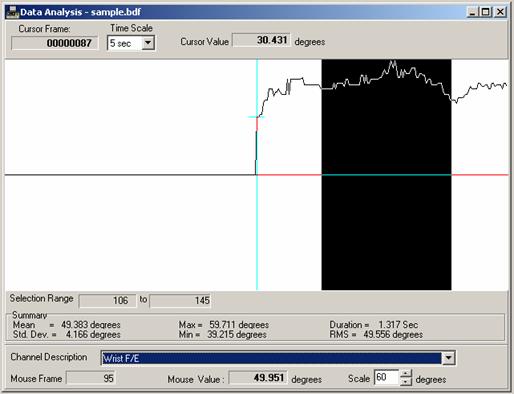
Summary information about the displayed waveform can be obtained by selecting the Summary option in the Data menu (See Figure 12). Basic statistics are displayed on the selected range. The range is selected by SHIFT-dragging the mouse cursor over the desired portion of the waveform. The time information is shown in the Selection Range display.
Filtering can be performed on the displayed waveform by selecting the Filtering and/or Smoothing options in the Data menu (See Figure 13). Derivative, Double-derivative and cubic spline are available from the Filter option. The Smoothing option provides a 5-point least squares polynomial smoothing and a special spike removal smoothing. The spike removal routine removes any differences in adjacent data point greater than the threshold value and replaces it with the previous data point.
|
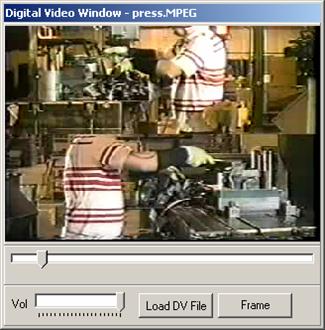
The MVTA program provides a convenient method for controlling and displaying the video images for analysis. When the analysis is performed from videotape using a VCR, the VCR controls windows provide an extension of the physical controls of the VCR. When digital video files (AVI, MPEG, MPG) are used, the VCR control windows provides the controls for the display of the video file. For the VCR, a video tape must be loaded into the machine. Likewise the digital video file must also be loaded (see section 6.1.9) . Analysis using digital video files allows for more instantaneous response between the MVTA program and the displayed video image, not having the delays inherent to the physical VCR due to mechanical motion of the videotape. However, videotape analysis allows up to two hours of contiguous video whereas digital video files are limited by the available storage space. Digital video files with resolutions of 320 x 240 pixels and reasonable visual quality can easily be 1MB/s making a one minute video file 60MB is size. Large hard drives, greater than 8 GB are available, permitting nearly two hours of digital video. Higher resolution and quality will greatly reduce the length of digital video files.
|
The VCR functions and control displays are available in the VCR control window. Complete control of the VCR is possible with the current mode and frame number displayed in the VCR control window (Figure 14).
Frame Backward Moves video back a specific number of frames. Clicking this button moves the video N-frames back. Right-clicking the button moves one frame back. The number of frames moved for a click can be changed by SHIFT-Clicking the button (Press and hold the SHIFT key and Click on the button).
Frame Forward Moves video forward a specific number of frames. Clicking this button moves the video N-frames ahead. Right-clicking the button moves one frame ahead. The number of frames moved for a click can be changed by SHIFT-Clicking the button (Press and hold the SHIFT key and Click on the button).
Frame Number Current Frame Number.
Search/Shuttle Button Activates the Search/Shuttle mode. Clicking this button when currently in shuttle mode will set the shuttle speed to zero (still-frame).
Search/Shuttle Speed The scrollbar controls the reverse/forward search/shuttle speed. Shuttle mode is automatically entered when the settings are changed. The video is in STILL mode when the control is in the center position. Sliding the control to the right of center will slowly play the video in forward direction. Sliding the control to the left of center will slowly play the video in backward direction. The speed of the playback is determined by how far the control is moved from center. The further from center the faster the playback. The effectiveness of the search/shuttle playback is directly influenced by the videotape player or the computer playing the digital video, and not the MVTA program.
VCR Driver Version Number Displays the current VCR driver version and VCR used. Double-clicking on the version number provides access to the VCR/Communication port setup dialog box. The letter after the number indicates the current VCR driver being used. The letter V is for virtual VCR, P for Panasonic, and M for Media Commander Interface.
VCR Mode Current VCR Mode.
Key |
VCR Function |
< HOME> |
Rewind |
< - END> |
Fast forward |
< PageUp> |
N-frame step forward |
< PageDown> |
N-frame step backward |
<SPACE > |
Stop |
< > |
Play |
< ¯ > |
Pause |
< ¬ > |
In Pause or Stop Mode -Back one frame or Mouse Wheel Or In Play, Shuttle, or Search Mode - Adjust Shuttle/Search Speed |
< ® > |
In Pause or Stop Mode - Forward one frame or Mouse Wheel Or In Play, Shuttle, or Search Mode - Adjust Shuttle/Search Speed |
When the VCR control window is not displayed, the VCR functions can be accessed from the keyboard when the motion analysis window is active. The following keys can be used to control the VCR.
|
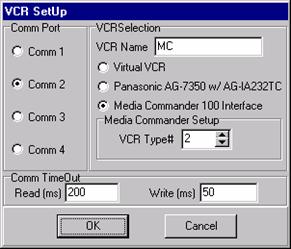
All the communication port and VCR type settings are accessed through this dialog box. An initial setup is required after each software installation.
Comm Port selects the serial port used for communication between the computer and the VCR. Select any available comm port. Currently only comm ports 1 to 4 are supported.
VCR Selection indicates the VCR/Interface used by the MVTAT program. Currently MVTAT supports three VCR/Interfaces. Select the VCR/Interface that will be used.
• The virtual VCR provides software that mimics the function of a physical VCR when video info is not required, such as during analysis and report generation. This mode also activates the digital video (AVI, MPEG, MPG) file feature for allowing analysis from digital video files stored on the hard drive or CD-ROM instead of from video tape.. See section 6.1.9 for the procedure for loading a digital video file.
• The Panasonic AG-7350/7355 with the AG-IA232TC module is directly supported. The greatest control and responsiveness between the computer and VCR are provided in this configuration.
• FutureVideo Media Commander 100 Interface provides a standard interface for using many different types of VCRs with the MVTAT program for maximum flexibility. An external interface box is required between the computer and the VCR, which must be purchased separately. The VCR Type# (see Media Commander documentation) is entered for the VCR used.
Comm TimeOut is a technical parameter that controls communication between the computer and the VCR/Interface. These values are determined automatically by the program for optimal communication between the program and the serial port for VCR control. These values are changed only if communication problems arise. Alter these values only if you have the appropriate technical expertise.
|
Last Updated: 2/25/2005
Webmaster: mvta@engr.wisc.edu